
BCC Geospatial Center of the CUNY CREST Institute
Built from the Ground Up since 2014 [Certified by the CUNY Board of Trustees]


Sentinel-1
What's Sentinel-1?
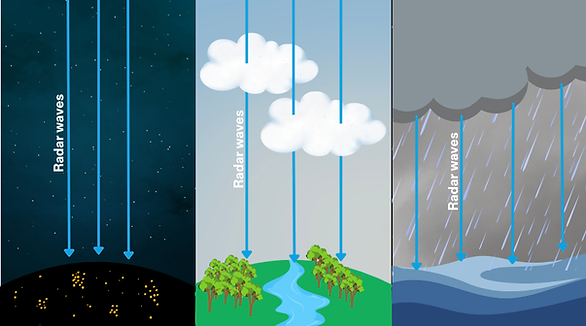
Imagine having a space camera that can see in the dark, through clouds, and even during storms.
That’s what Sentinel-1 does. It doesn’t use regular light — it uses radar waves to scan the Earth’s surface, day or night, rain or shine.
How is this useful?

Flood Watcher
Watches out for floods even during storms and rains , or even in remote areeas
How Is It Different from a Regular Camera?
-
Sentinel-1 doesn’t see the world the way we do.
-
It listens for echoes.
-
Like shouting in a dark cave and figuring out the shape of the space from the sound.
-
It sends radar waves, listens for the bounce back, and creates a map of what’s below.
.png)
Sentinel-1 Uses Radar — But What Kind?
Sentinel-1 uses microwave (specifically C-band radar), which works kind of like a bat's echolocation.
It’s good at seeing texture, moisture, and surface change.
Think of it as a flashlight made of radio waves.
Different satellites use different types of radar, each revealing a different layer of the Earth:
-
C-band: Like a pair of clear sunglasses. It gives a good, balanced view of the surface, useful for spotting changes in land or ice.
-
L-band: Think of it like X-ray vision for trees and soil. It can see through leaves and even shallow ground to spot changes underneath.
-
X-band: Like a magnifying glass. It captures tiny surface details, perfect for spotting cracks in roads or small shifts in buildings
Each “band” is just a type of radar, tuned to pick up a different kind of signal. Together, they help us see things we’d never catch with just our eyes.
.png)
How it Works (Raw Data Characteristics)
Sentinel-1 is the camera (with its special radar "flashlight"). Backscatter, Polarization, Coherence, Phase, and Amplitude are the ingredients or characteristics of the light (radio waves) that the camera captures.
Backscatter (σ⁰): How "Bumpy" or "Smooth" the Ground Is
Imagine you clap your hands in an empty gym (a smooth floor). The echo bounces back crisp and clear. Now clap in a messy room full of furniture and toys (a rough surface). The sound scatters everywhere, and the echo isn't as crisp or clear. Radar works the same way!
What it means: A strong backscatter (loud echo) means the surface is rough or has lots of things sticking up (like a forest or a city). A weak backscatter (faint echo) means the surface is smooth (like calm water or a flat road). This is the main "picture" you get from Sentinel-1 data.

VV / VH Polarization: Different Ways to "Shine the Flashlight
Think of it like this: Sentinel-1 can send its "flashlight beam" straight down (Vertical-Vertical, or VV) or it can send it straight down and listen for the echo that bounced back sideways (Vertical-Horizontal, or VH).
What it means: By comparing the VV and VH echoes, scientists can tell even more about what's on the ground. For example, some types of crops or forests will reflect differently depending on how the "flashlight" is angled, helping us identify them.
.png)
Coherence: What Has Changed?
Sentinel-1 visits the same spot on Earth more than once. If nothing has changed, the echoes from the two visits will be very, very similar – they "cohere" (stick together). If something has moved or changed (like a building falling down or the ground shifting), the echoes will be different, and you'll see a "low coherence" area.
What it means: This is super useful for detecting changes over time, like deforestation, new construction, or subtle shifts in the land.
.png)
Phase (InSAR): Feeling Tiny Ground Movements
When Sentinel-1 sends its "ping" and gets an echo, it not only measures how loud the echo is (amplitude/backscatter) but also the exact timing of the wave within the echo – this is called the "phase."
What it means: If the ground moves even a tiny, tiny bit (like a millimeter!), the timing of the echo will change ever so slightly. By comparing the phase from two different visits, scientists can see these tiny "ripples" or movements in the ground. This is how they can detect if a volcano is swelling, if a building is sinking, or if the land has shifted after an earthquake. It's incredibly precise!
.png)
Amplitude: How "Bright" the Echo Is
Amplitude is basically the "loudness" or "strength" of the echo that comes back. It's directly related to the "backscatter" we talked about.
What it means: Bright areas in a radar image (high amplitude) mean a strong reflection, usually from rough surfaces or objects that scatter the radar signal well, like buildings, forests, or rough water. Dark areas (low amplitude) mean a weak reflection, usually from very smooth surfaces that deflect the radar signal away, like calm water or smooth roads.

Sentinel-1 Uses Radar — But What Kind?
Data Products are the finished photo albums or recipe books that contain the above ingredients mentioned in different forms, ready for use.
The raw data is processed into different "photo albums" or "data levels" depending on what kind of information you need:
Ground Range Detected (GRD) Products
These are like a standard black-and-white radar "photograph." They show the Amplitude (or Backscatter) of the surface, making rough areas bright and smooth areas dark.
They come with Polarization information (e.g., you can get separate VV and VH images).
The Phase information is removed to make these files smaller and easier to use for general mapping (e.g., flood mapping, land cover change).
Single Look Complex (SLC) Products
These are the "full-detail negatives." They contain both the Amplitude and the crucial Phase information for every pixel.
They also contain Polarization data.
You need two SLC images from different times to perform advanced techniques like:
-
Interferometric SAR (InSAR): By comparing the Phase from two SLC images, scientists can measure tiny, millimeter-level ground movements (like subsidence, earthquake shifts, or volcano swelling).
-
Coherence: By comparing the phase similarity between two SLC images, you can create a "spot the difference" map. High coherence means little has changed; low coherence means significant changes occurred between the two radar scans (e.g., deforestation, new construction, snowmelt).
Wave Mode (WV) Products
These are small, specialized "snapshots" of the open ocean. They use SLC-like data to measure ocean wave patterns and wind speeds, crucial for maritime safety and ocean forecasting.